Note
Click here to download the full example code
Plotting projected density obtained from vasp_dos
This example shows how to plot projected density of states
import os
import numpy as np
import matplotlib.pyplot as plt
from pdos_overlap.vasp_dos import get_example_data
from pdos_overlap.vasp_dos import VASP_DOS
from pdos_overlap.plotting_tools import set_figure_settings
Load DOSCAR file
First we will, get the example data, load a DOSCAR file and use it to instantiate a VASP_DOS object.
set_figure_settings('paper')
example_path = get_example_data()
DOSCAR = os.path.join(example_path, 'C2H4/DOSCAR')
PDOS = VASP_DOS(DOSCAR)
Obtain projected density
We get the site and spin orbital projected density. We sum the individual spin orbital densities to get energy sub-level site projected densities.
orbitals, projected_density = PDOS.get_site_dos(atom_indices=np.arange(-6,0)\
                                            , orbital_list=['s', 'p', 'd']\
                                      , sum_density = True)
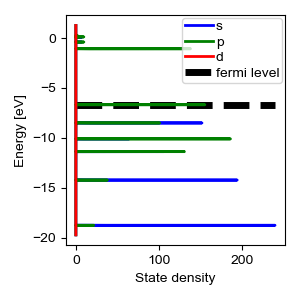
Plot projected density
We plot the projected density with the fermi-level indicated.
plt.figure(figsize=(3,3))
colors = ['b','g','r']
zorder = [2,3,4]
for count, density in enumerate(projected_density):
    plt.plot(density, PDOS.get_energies(), colors[count], zorder=zorder[count])
plt.plot([np.min(projected_density), np.max(projected_density)]\
         ,[PDOS.e_fermi, PDOS.e_fermi],'k--', zorder=1, linewidth=5)
plt.legend([i for i in orbitals]+ ['fermi level'])
plt.xlabel('State density')
plt.ylabel('Energy [eV]')
plt.show()
Out:
C:\Users\lansf\Box Sync\Synced_Files\Coding\Python\Github\pdos_overlap\examples\plot_projected_density\plot_projected_density.py:56: UserWarning: Matplotlib is currently using agg, which is a non-GUI backend, so cannot show the figure.
  plt.show()
Total running time of the script: ( 0 minutes 1.038 seconds)